Using mrg-iot
The complete workflow: account setup, installation, running an experiment, interacting with devices, collecting the data, and releasing the hardware.
This guide takes you end to end: account, tool, experiment, interaction, data, cleanup. If you already have an account and just want the commands, use the Quickstart instead.
IoT device support is currently in beta. Report issues and share feedback with the NEU IoT Facility.
Everything below is driven by mrg-iot, which runs on your own machine. Each command opens its own session to the experiment and closes it when it is done, so any command here can be scripted exactly as written.
mrg-iot --help lists every command group, and --help on any group or subcommand (for example mrg-iot exp setup --help) lists its flags and the value each one defaults to. mrg-iot --version (or -v) prints the installed version. Every command and its flags is also listed in the Command reference, one page per command group.
1. Create a SPHERE account
1a. SPHERE portal account
IoT devices are reserved through the SPHERE portal, so you need a portal account before anything else. The process (registering an identity, choosing a username, and having an administrator approve the account) is the same as for any other SPHERE experiment and is covered in full here:
In short: sign up at launch.sphere-testbed.net (or with mrg register from the CLI), wait for approval, and note the username and password you chose. mrg-iot logs in with exactly those credentials.
You do not need to install the mrg CLI or set up an SSH key to use IoT devices. mrg-iot talks to the portal itself and fetches the SSH key it needs for the XDC automatically.
1b. IoT project access
An approved portal account is not enough on its own. Your account also has to be a member of an IoT project. These are the projects that own the IoT hardware:
| Project | Use |
|---|---|
neuiot | The production IoT inventory at Northeastern. |
iotbeta | Pre-release devices and features. |
iotdev | Facility development and testing. |
Most researchers want neuiot. Request membership through the portal at launch.sphere-testbed.net, or ask the NEU IoT Facility to add you. Once you are a member, this command lists devices instead of an error:
mrg-iot devices list --available --project neuiot
--project is optional, because mrg-iot uses your only project automatically. It is required only when you belong to several, and the error message lists which ones you can pick from.
2. Log in
This guide assumes mrg-iot is already on your PATH. If it isn’t, see Installation, then come back here.
mrg-iot login                                  # prompts for username and password (3 attempts)
mrg-iot login -u myuser                        # prompts for the password only
mrg-iot login -u myuser --password-stdin < f   # reads the password from stdin
mrg-iot logout                                 # clears the stored session
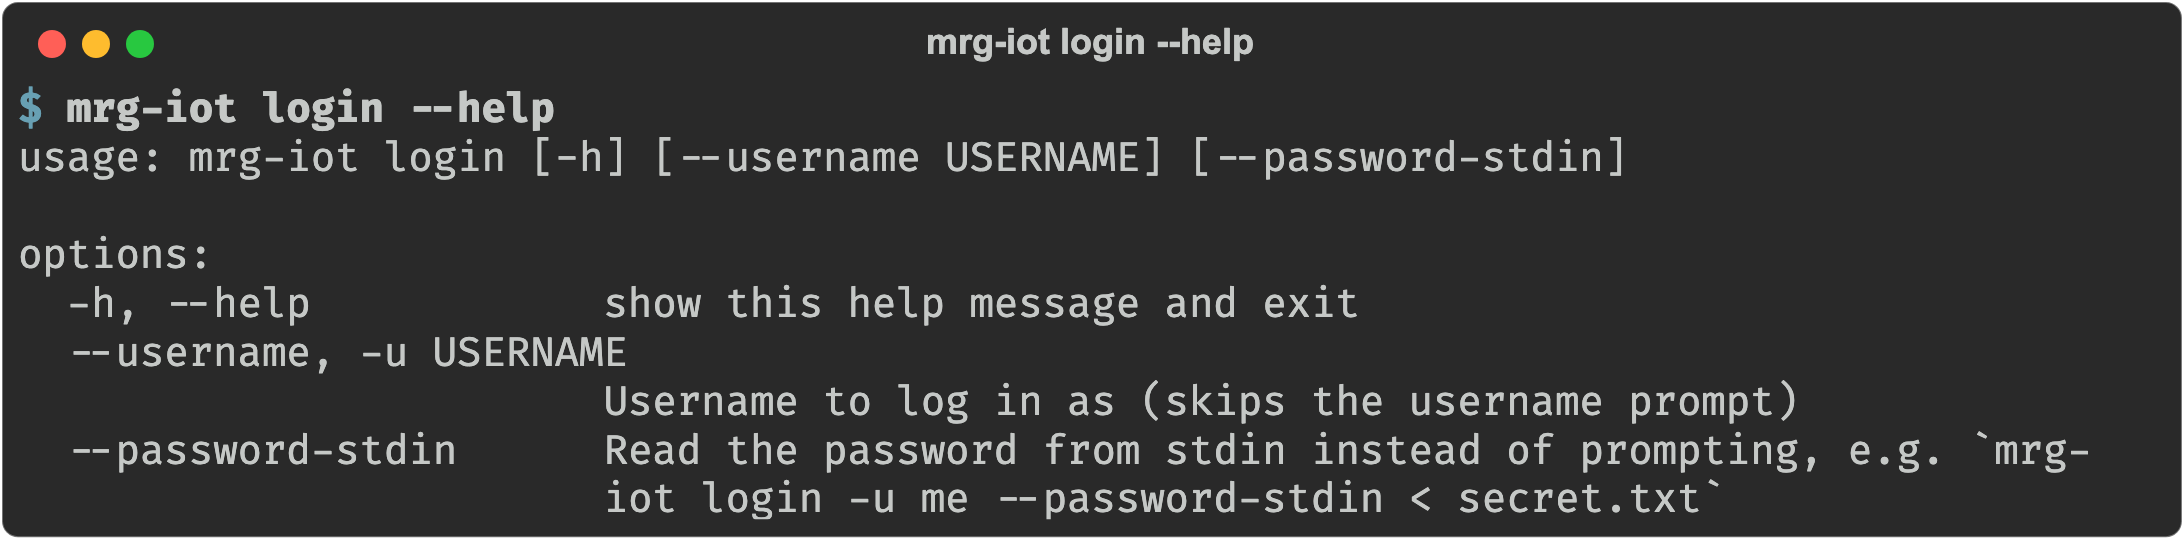
The session is cached at ~/.mrg-iot/session.json (mode 0600). Every authenticated command re-validates the stored token and only re-prompts if the portal rejects it, so you rarely log in more than once. A brief network outage does not cost you the session: if the portal simply can’t be reached, the cached token is kept. If you are already logged in, login says so; run mrg-iot logout first to switch accounts.
Unattended login (scripts and CI)
Set credentials in the environment instead, and skip login entirely:
# Either an existing bearer token...
export MRG_IOT_TOKEN=<token>
export MRG_IOT_USERNAME=<username>   # optional; used for display and SSH key lookup

# ...or a username and password, exchanged for a token normally.
export MRG_IOT_USERNAME=<username>
export MRG_IOT_PASSWORD=<password>
MRG_IOT_TOKEN takes precedence and skips the login call. MRG_IOT_USERNAME and MRG_IOT_PASSWORD must both be set to take effect.
If a command needs credentials, none are cached or set in the environment, and stdin is not a terminal, mrg-iot exits with an explanation instead of waiting for a prompt nobody can answer.
Deliberately so: on Linux any user can read another process’s arguments from /proc/<pid>/cmdline, and on every platform the command lands in shell history and CI logs. Use --password-stdin or MRG_IOT_TOKEN.
3. Run an experiment
3a. Choose your devices: mrg-iot devices
The devices group answers two questions: what is free to reserve, and what is in an experiment you already have.
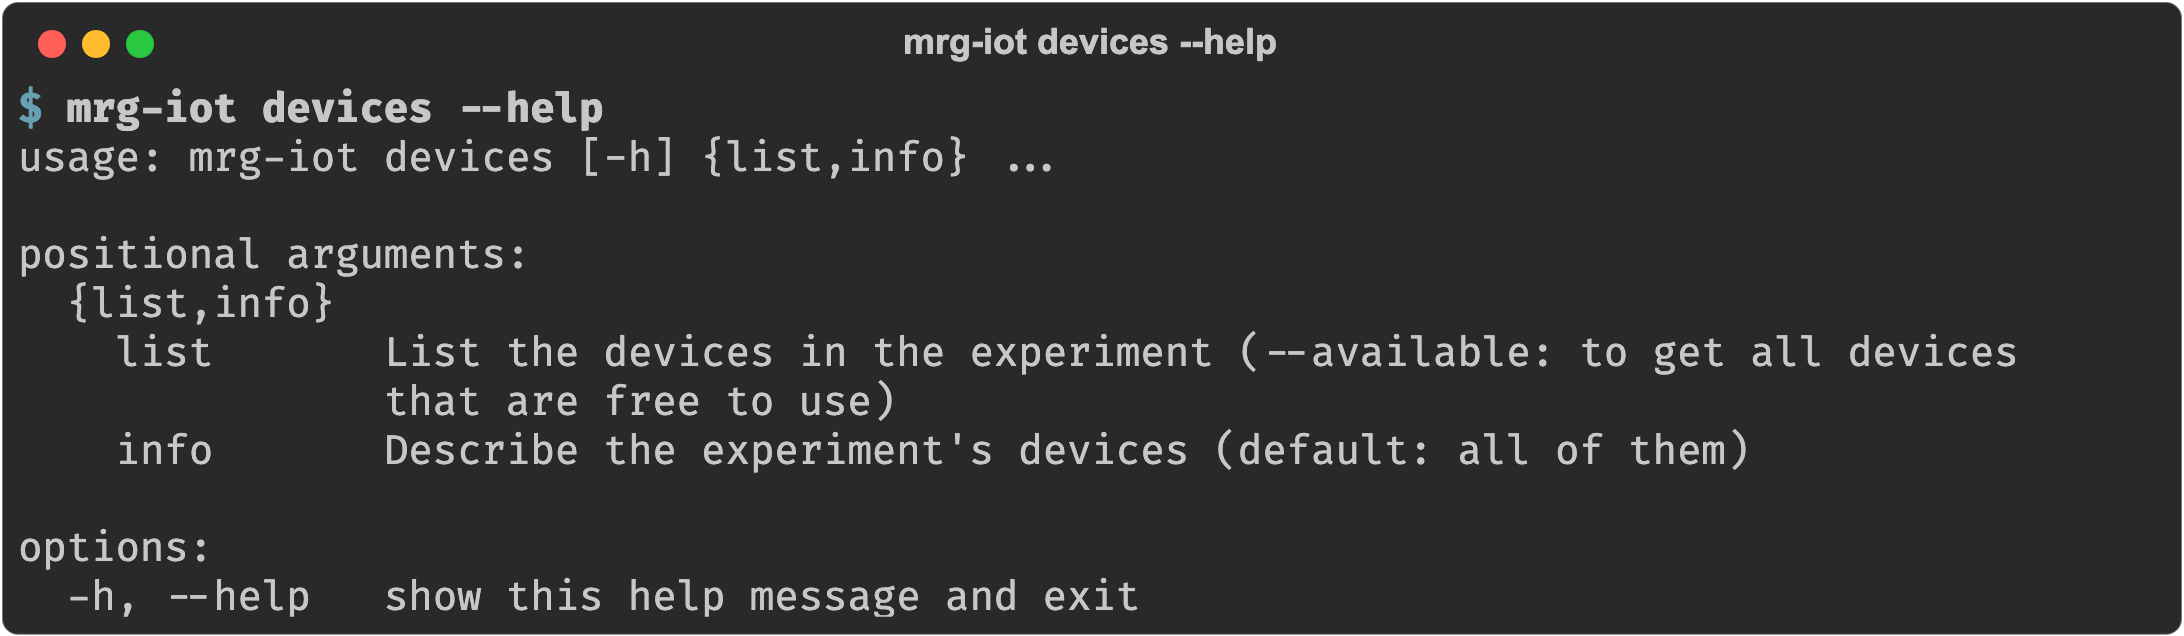
Before you can reserve anything you need device names. devices list --available (or -a) asks the portal which devices no experiment currently holds:
mrg-iot devices list --available
mrg-iot devices list --available --project neuiot   # one project only
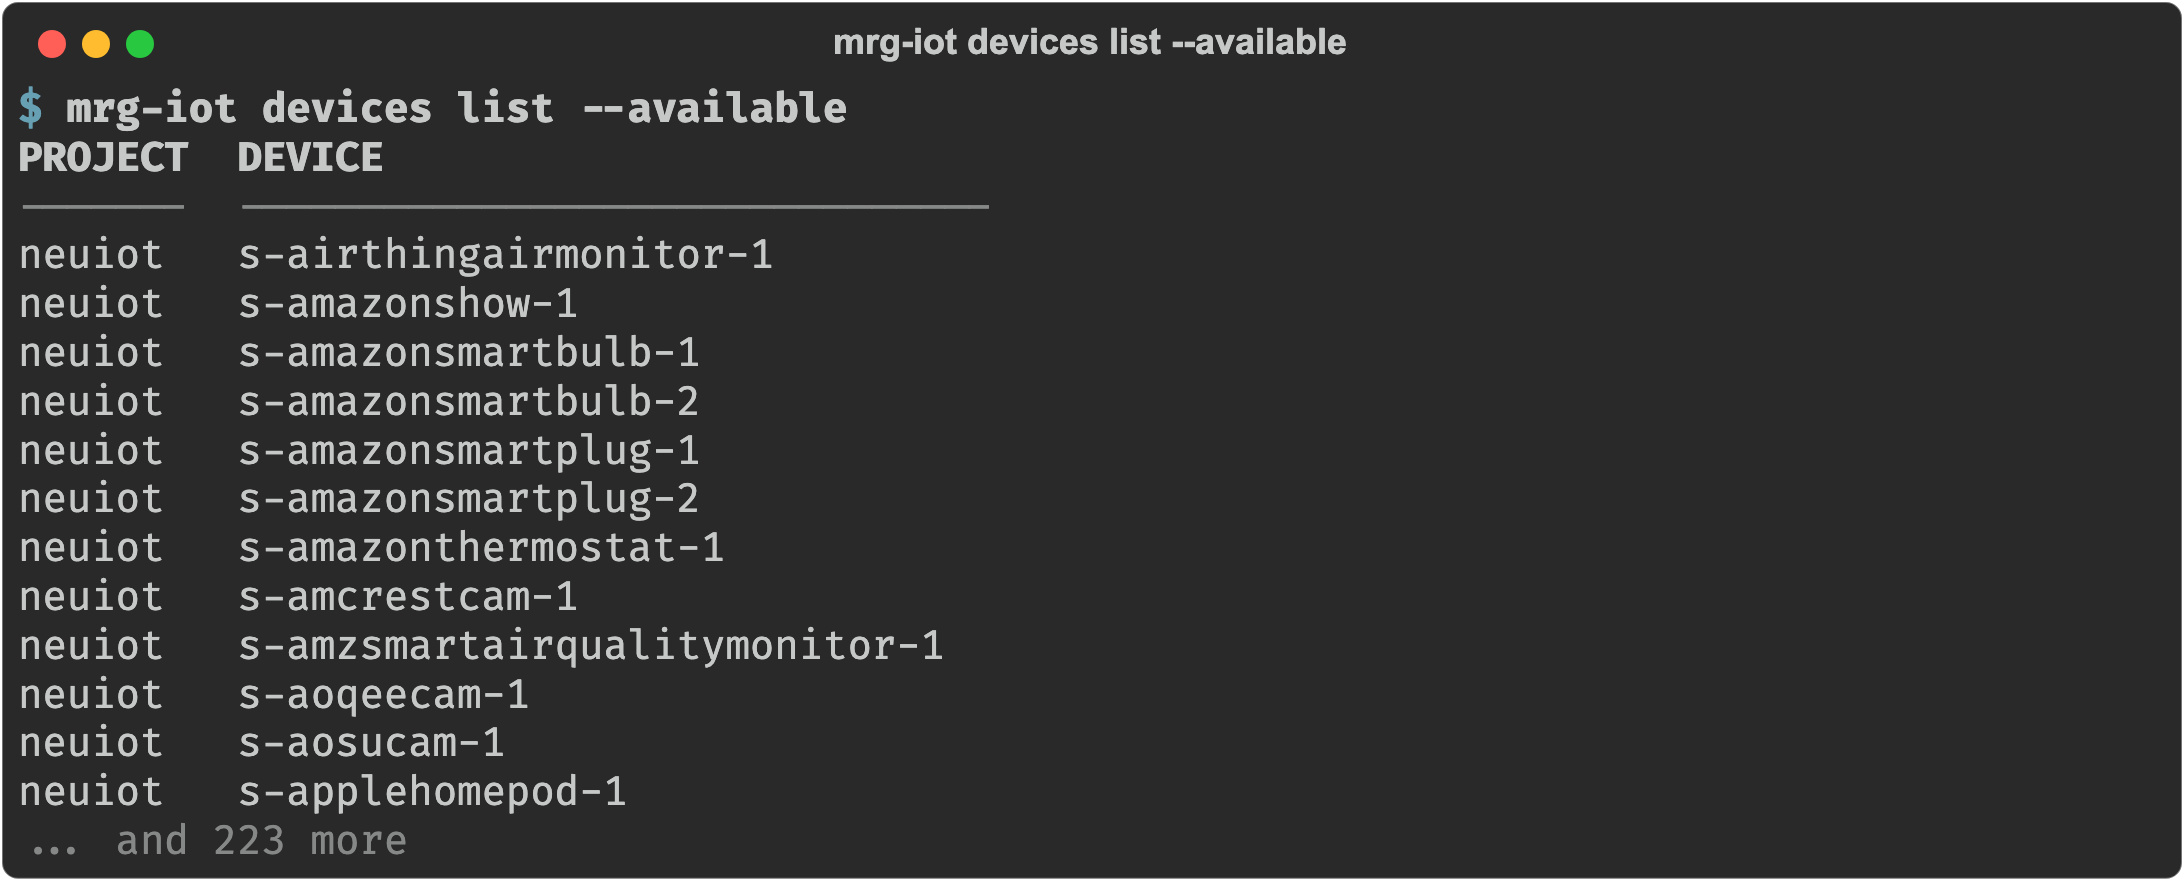
Device names are of the form <prefix>-<model>-<n>, e.g. s-echodot-1. This is the one device command that opens no session. It is pure inventory, and it hides devices that are already allocated, including the ones your own experiment holds.
The prefix says what kind of thing the name refers to:
| Prefix | Meaning |
|---|---|
s- | A device under test, e.g. s-echodot-1. These are what you reserve and send commands to. |
m- | A helper phone, e.g. m-googlepixel-1: a handset used to drive a device’s companion app. These are being brought online and will start appearing alongside the s- names. |
h- | A handler, e.g. h-camera-2: the testbed hardware that acts on a device or watches it. You never address these directly; cameras are named by mrg-iot stream list instead. |
mrg-iot already reads both s- and m- names out of the experiment’s banner, so devices list and devices info will report helper phones as soon as they are in your experiment. Only s- names are routed for commands today, and addressing an m- name returns a message saying so rather than failing silently.
Once an experiment is running, the same command without --available names the devices that experiment is about:
mrg-iot devices list --experiment myexp

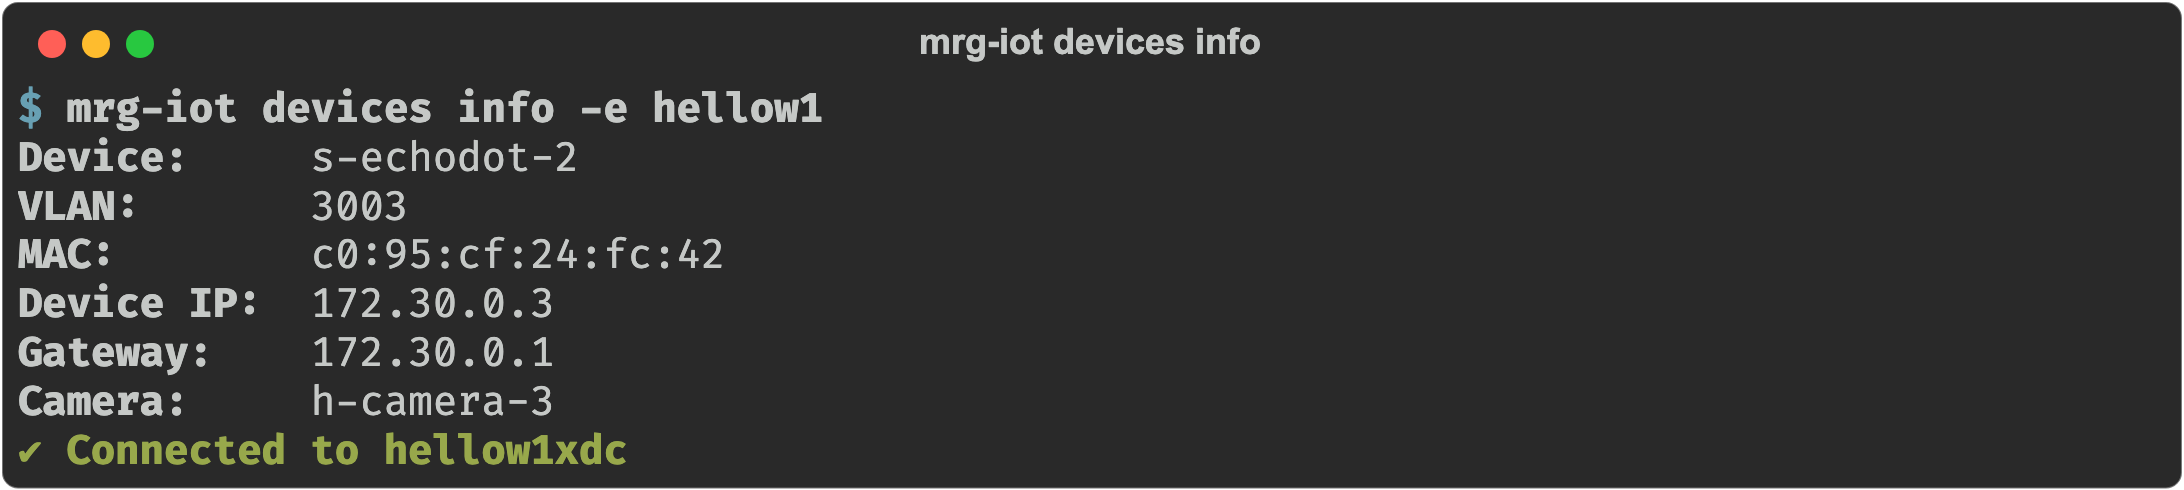
And devices info prints what the experiment publishes about each one: VLAN, MAC, addresses, and the camera watching it, if any.
mrg-iot devices info -e myexp                       # every device
mrg-iot devices info -e myexp -d s-echodot-1        # just one (space- or comma-separated for several)
3b. Run the experiment: mrg-iot exp
The exp group owns the whole lifecycle. Its verbs pair up: create/delete, deploy/undeploy, and setup/teardown for both halves at once.
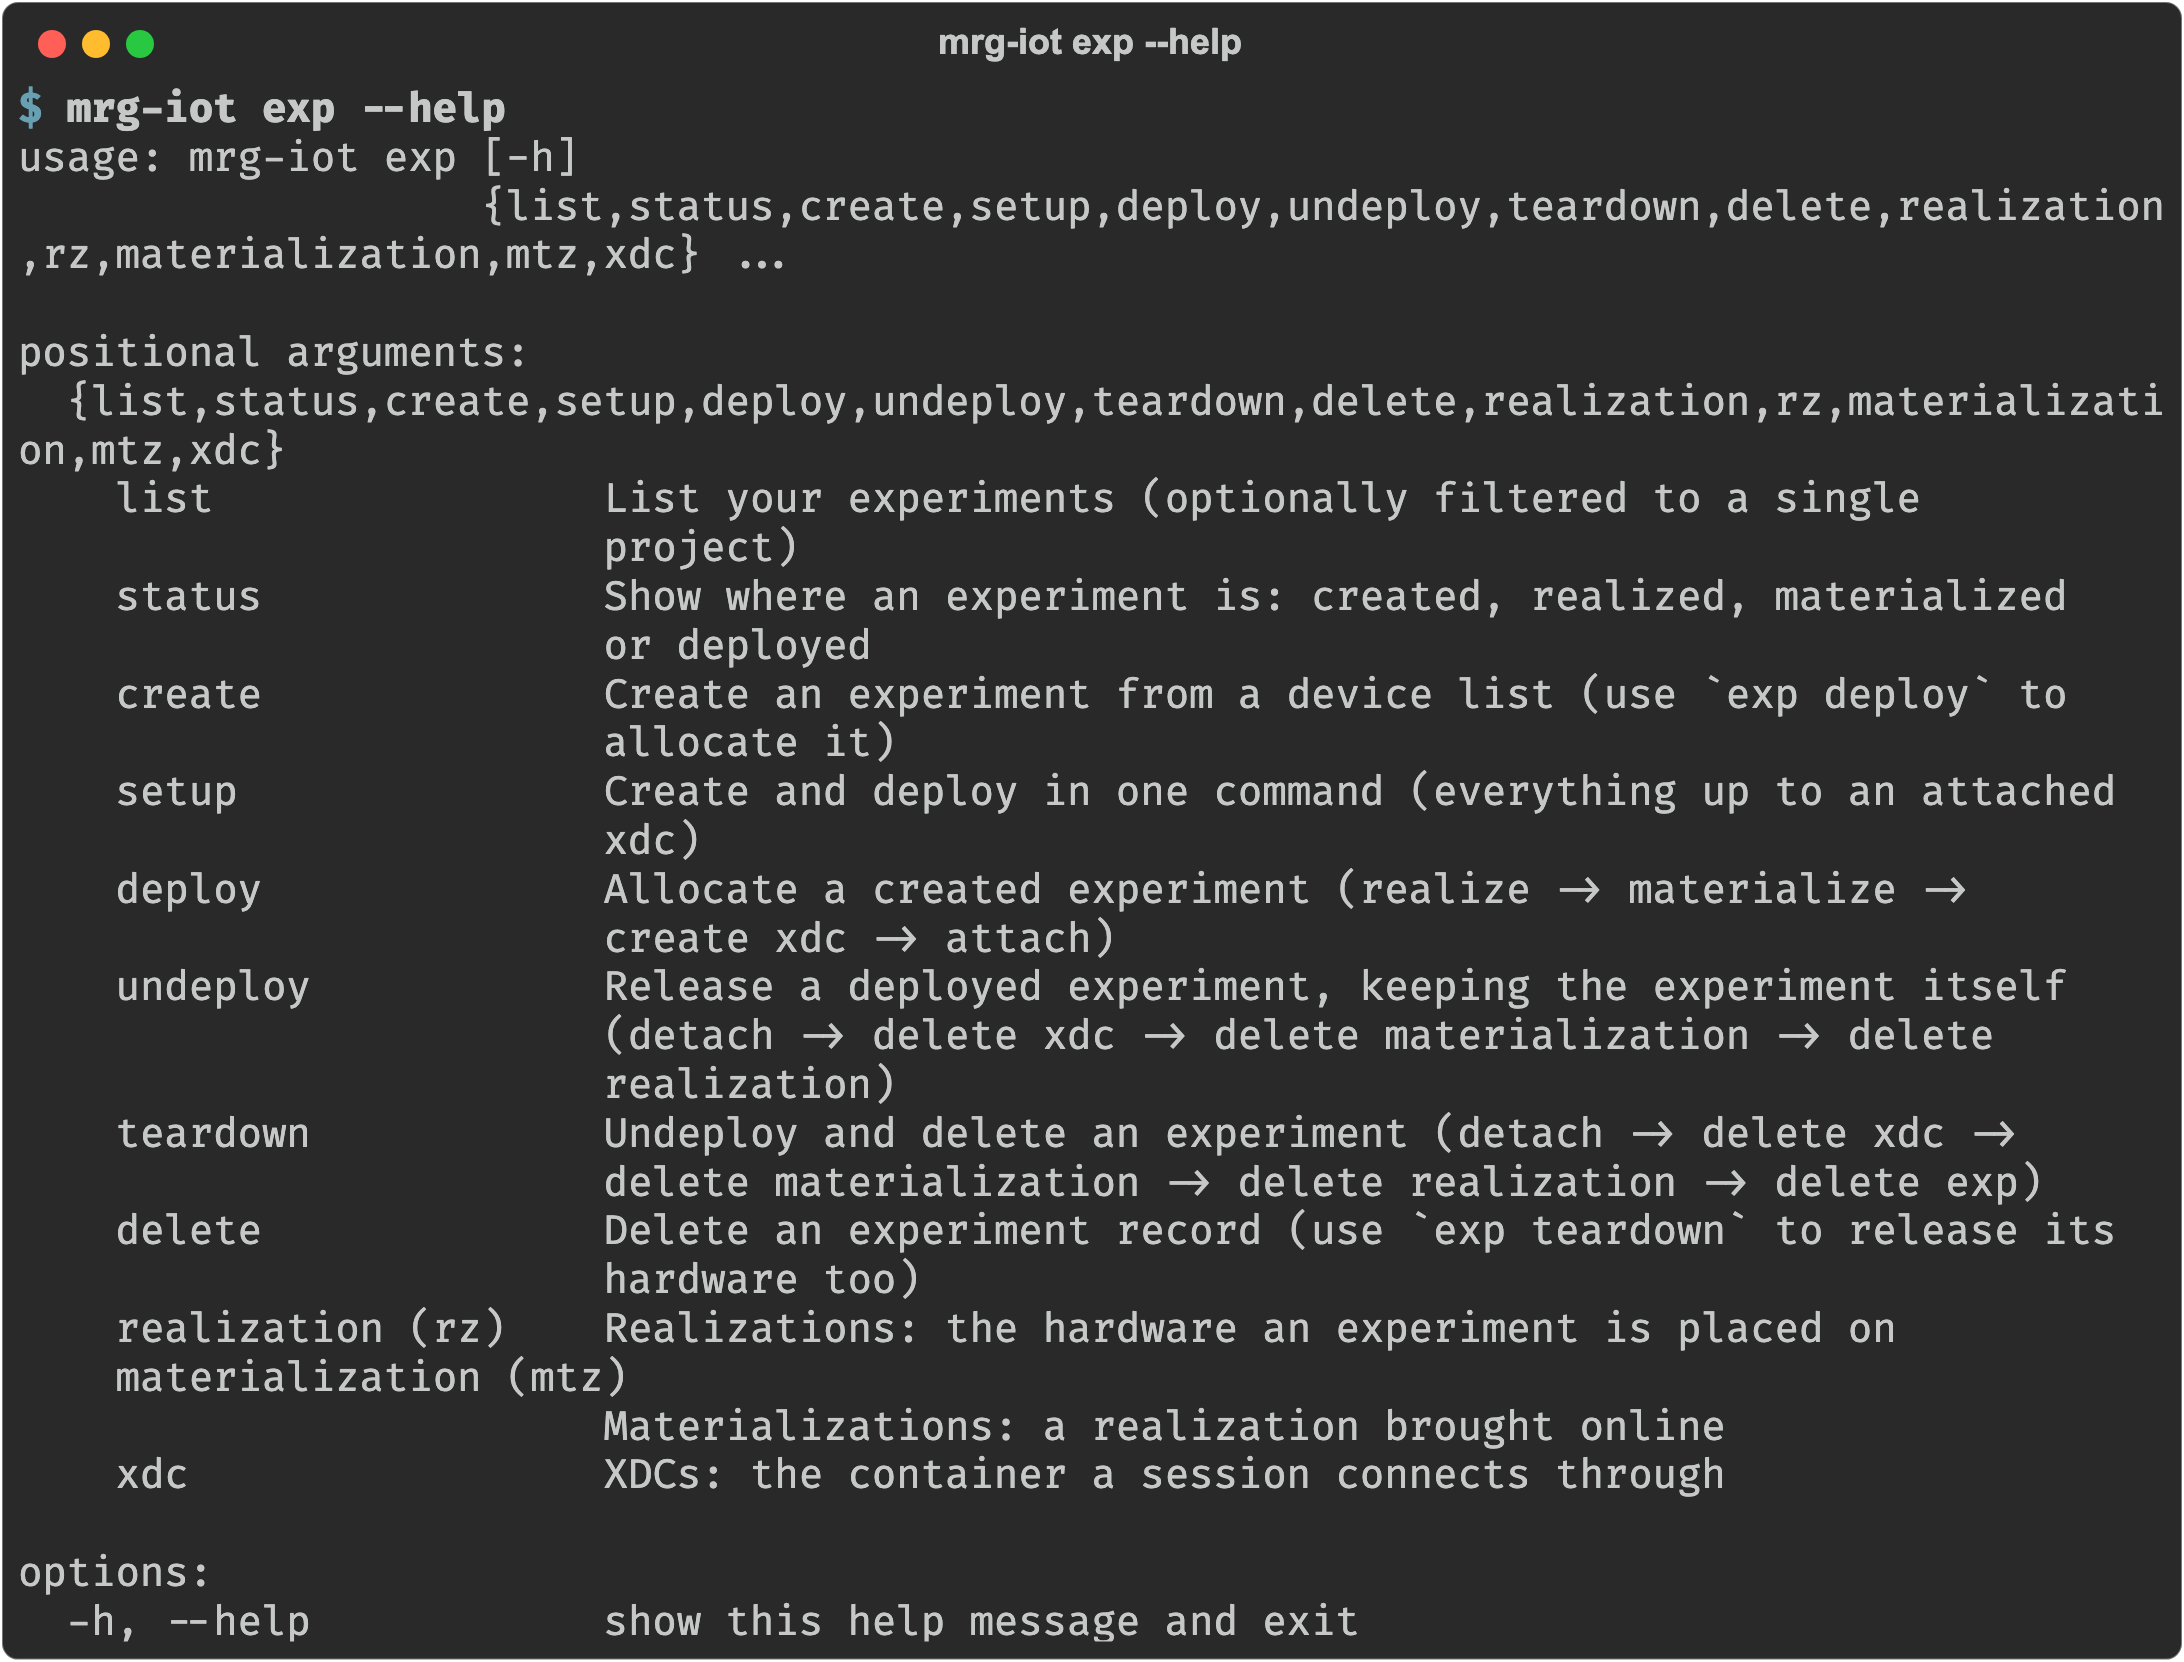
exp setup does the whole provisioning sequence in one command: it creates the experiment and its network model, realizes it (allocates the hardware), materializes it (brings the hardware online), creates an XDC, and attaches the two. It waits up to about 5 minutes for the new XDC to accept connections.
mrg-iot exp setup myexp --devices s-echodot-1 s-googlenest-1

Check where it got to at any time:
mrg-iot exp status myexp
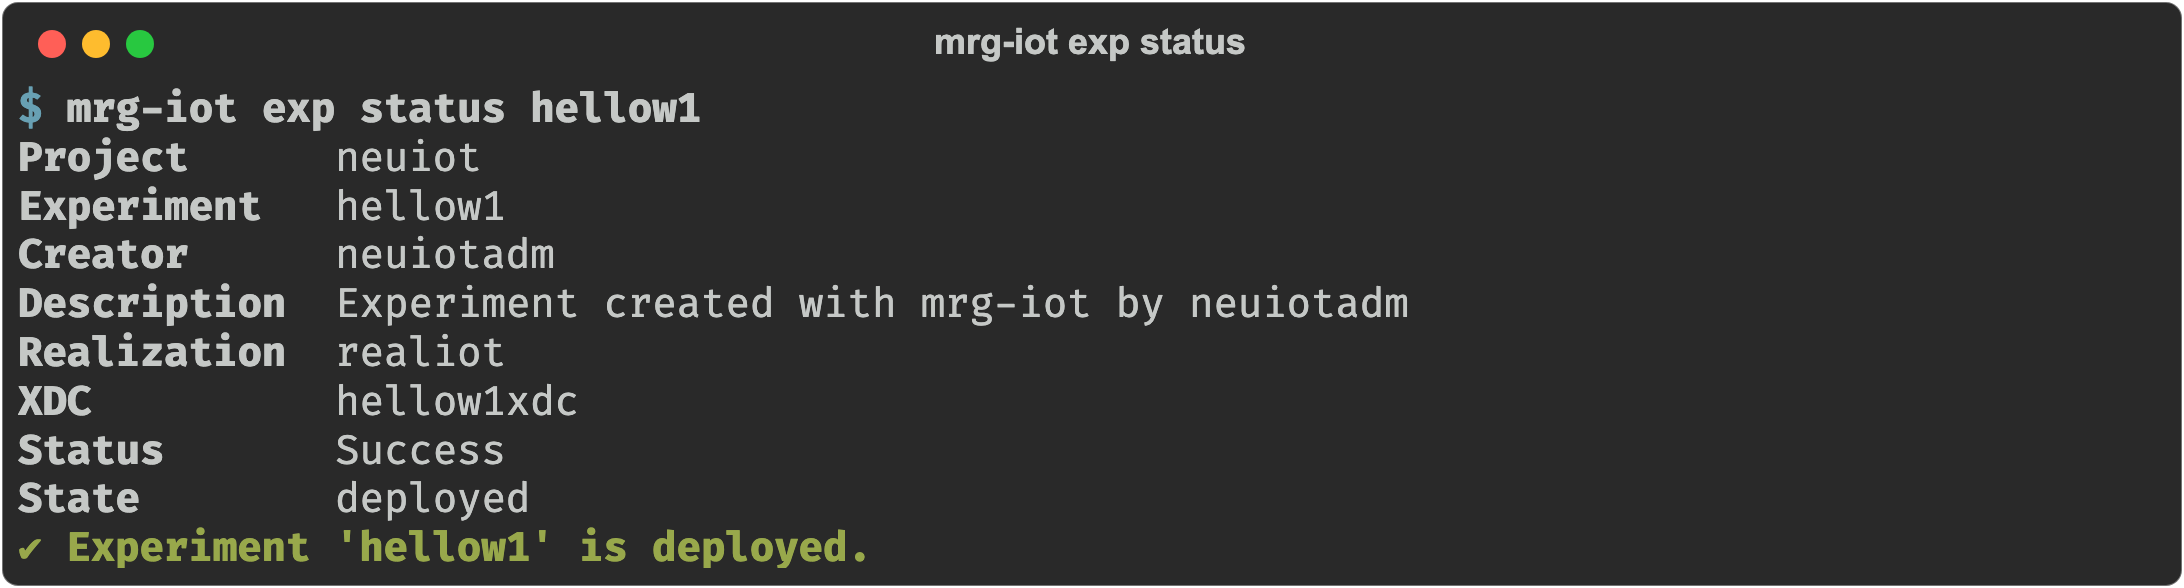
The state advances created → realized → materialized → deployed. deployed is the one you can send commands in.
What you can leave out
Only two things are ever required: the project (and only if you belong to more than one) and, on the commands that build a model, the device list. Everything else is derived rather than prompted for.
| Argument | Default |
|---|---|
--project, -p | Your only project. Required when you have several. |
--devices, -d | No default. Required by exp create and exp setup, which build the model from it. |
--experiment, -e / NAME / --name, -n | Your username, so user jsmith gets experiment jsmith. The exp verbs take it as a positional NAME or as --name; every other group takes --experiment. |
--xdc, -x | <experiment>xdc, so exp setup myexp provisions myexpxdc. |
--realization, -r | realiot |
--duration, -dur / --xdc-duration, -xdur | 1w (minimum 4d) |
--network, -net | mrg-iot-net |
--description, -desc | Experiment created with mrg-iot by <username> |
So the shortest useful invocation is:
mrg-iot exp setup --devices s-echodot-1
Every one of those defaults is still overridable by its flag. exp setup --help lists them with the value each falls back to:
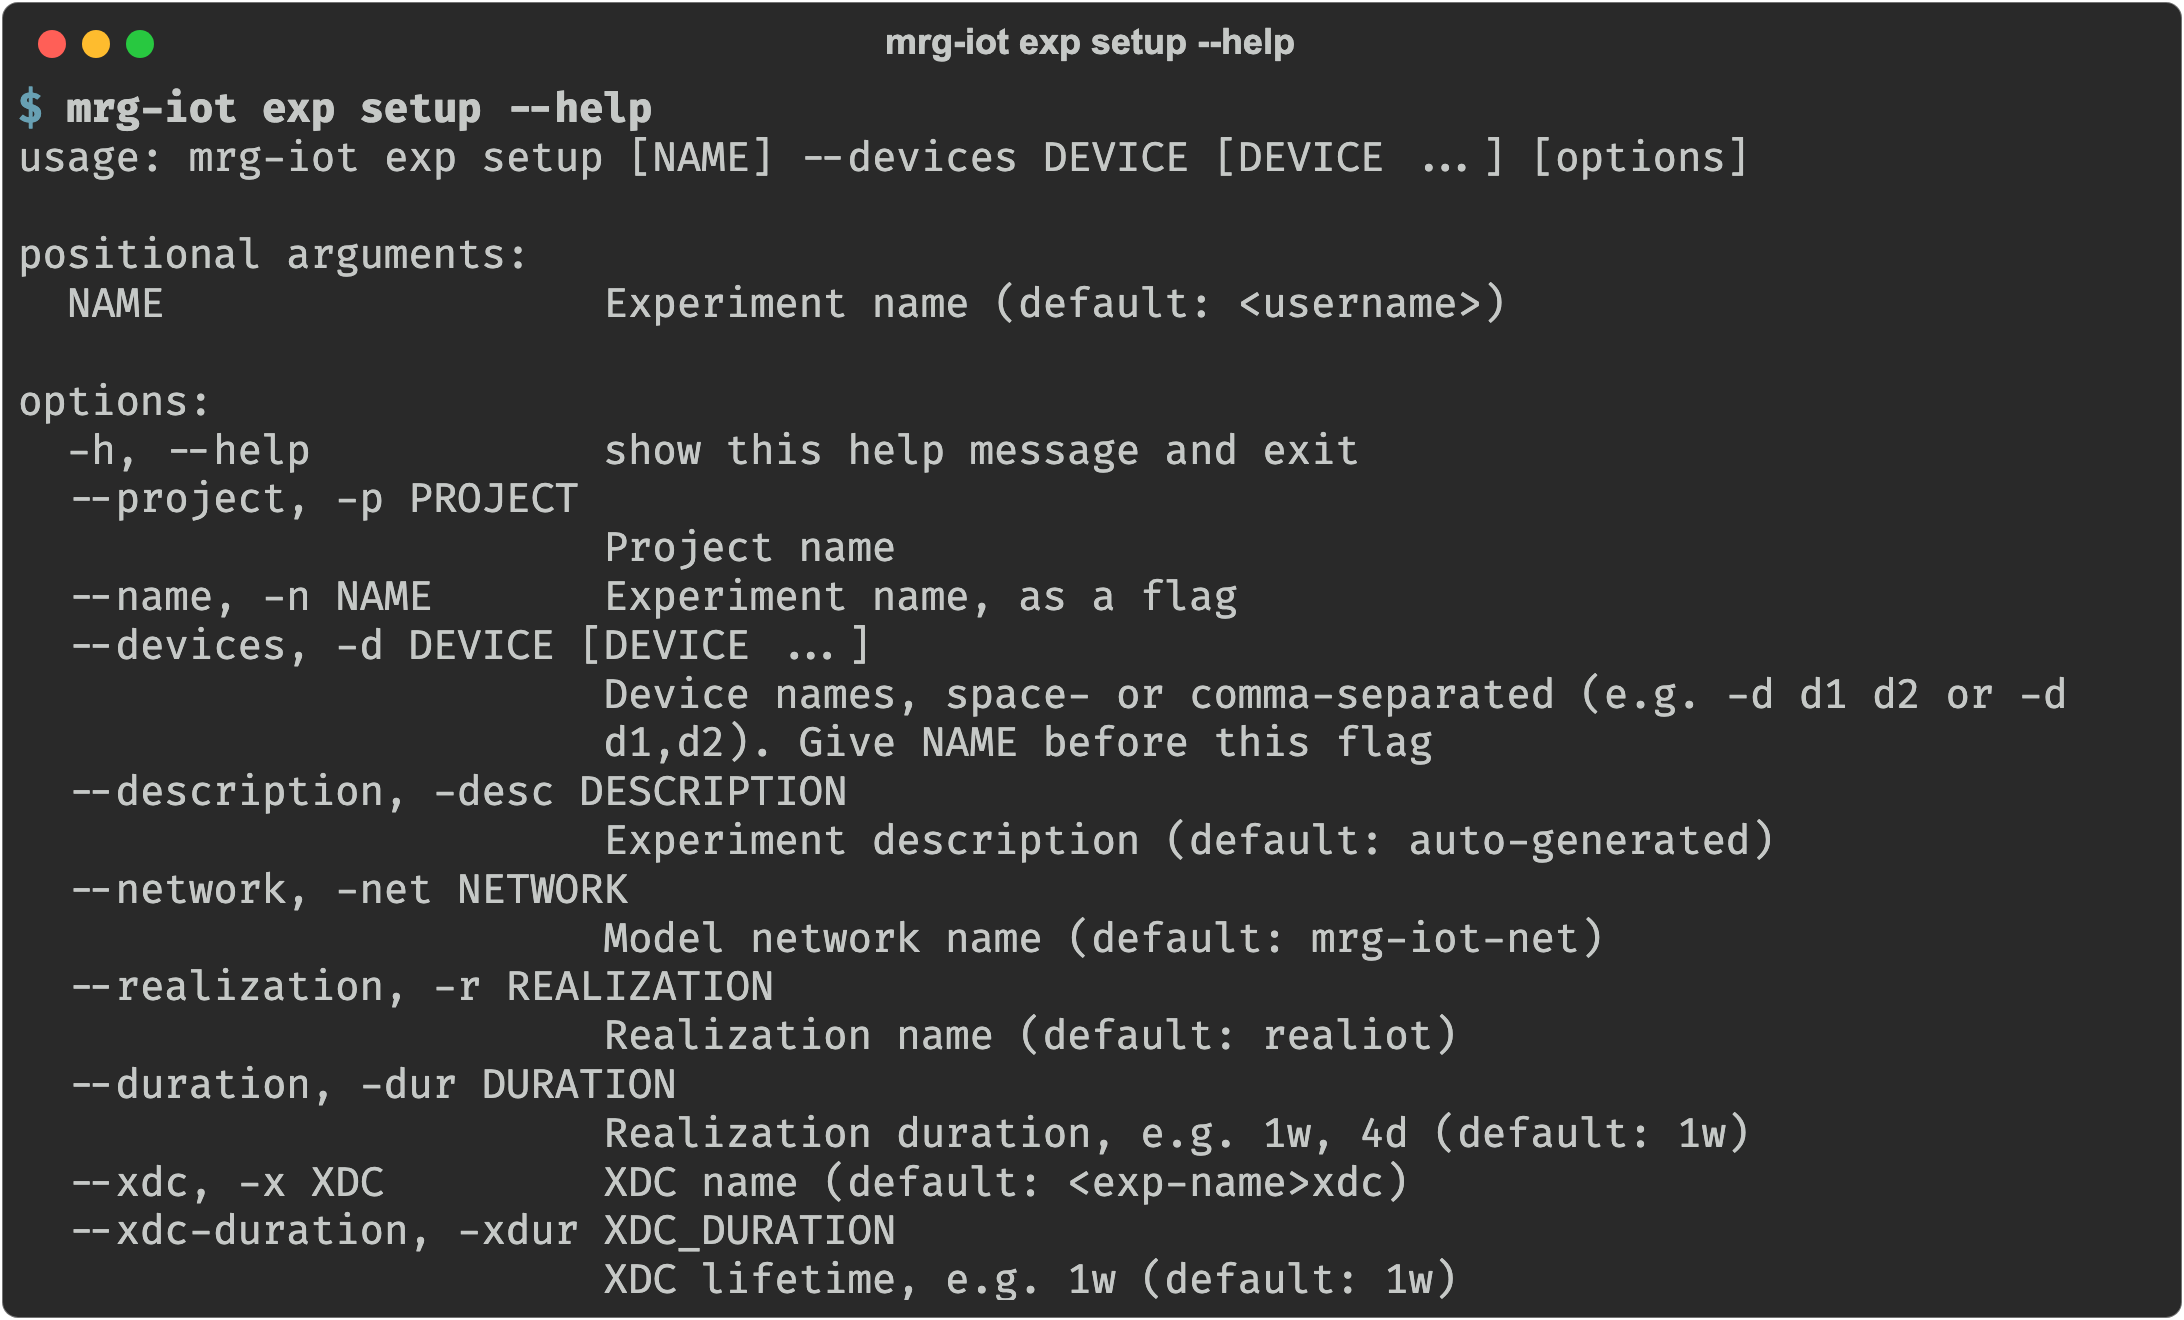
If a derived name points at something that doesn’t exist, the error says which name it tried and which flag overrides it. The command never stops to ask.
Names you choose (experiment, realization, XDC, network) must match ^[a-z][a-z0-9]*$: start with a lowercase letter, lowercase letters and digits only, no hyphens, underscores, spaces, or capitals, max 32 characters. This does not apply to device identifiers like s-echodot-1; those come from the testbed and you pass them through as-is.
Durations must be at least 4 days. 1w, 4d, 1w2d3h, and 1 week are all accepted; anything shorter is rejected with exit code 2.
Descriptions may contain letters, digits, spaces, commas, periods, and hyphens, up to 256 characters.
Expiry notices go out 3 days before an XDC expires and 1 day before a realization expires.
If provisioning fails
exp setup rolls back on failure: if any step fails, it removes everything it had created, including the experiment, and exits with the code for the step that failed (see Exit codes). exp deploy does the same for what it created, but keeps the experiment, since that existed before the command ran. If the rollback can't remove something, the command names what is still allocated and prints the exp teardown command that finishes the job.
Pressing Ctrl-C is different: the command stops at once (exit code 130) and keeps whatever it had already created, so you can pick up from there with exp status and exp deploy, or clear it with exp teardown.
Step by step, if you prefer
exp setup is exp create plus exp deploy. Splitting them is useful when the experiment should outlive your terminal, or when several people share one enclave:
mrg-iot exp create myexp --devices s-echodot-1   # experiment + model; nothing allocated
mrg-iot exp deploy myexp                         # realize → materialize → xdc → attach
mrg-iot exp list                                 # yours; --all (-a) for everyone's, --project to filter

--devices is greedy, so exp create -d d1 d2 myexp reads as three devices and no name. Write exp create myexp -d d1 d2. The flag takes either spelling, -d d1 d2 or -d d1,d2, and drops duplicates.
Splitting them also means the hardware and the experiment record can be released separately later. See §6.
One resource at a time
exp deploy, exp undeploy, and exp teardown each run several steps in order. To run a single step, or to inspect one resource, each resource has its own subgroup: exp realization (short form exp rz), exp materialization (exp mtz), and exp xdc.
mrg-iot exp rz create -e myexp --devices s-echodot-1   # build the model, push it, and realize it
mrg-iot exp mtz create -e myexp                        # bring the realization online
mrg-iot exp xdc create -e myexp                        # create the XDC and wait until it is ready
mrg-iot exp xdc attach -e myexp                        # attach it to the materialization
| Command | What it does |
|---|---|
exp rz create | Build the model, compile and push it, and realize it. Takes --devices, --network, --duration, and --name (the realization name). |
exp rz list / exp rz status / exp rz delete | List an experiment's realizations, show one, or delete one (releasing its hardware). |
exp mtz create | Materialize a realization so it is ready to connect to. |
exp mtz list / exp mtz status / exp mtz delete | List an experiment's materializations, show one, or delete one (ending the running experiment). |
exp xdc create | Create an XDC and wait until it accepts connections. --no-wait (-nw) returns as soon as the portal takes the request; --duration sets its lifetime. |
exp xdc attach / exp xdc detach | Attach an XDC to a materialized realization, or detach it. |
exp xdc list / exp xdc status / exp xdc delete | List XDCs (all your projects, or one with --project), show one, or delete one. |
These take the same flags as everywhere else, with the same defaults: --project/-p, --experiment/-e, and --realization/-r. The two exceptions name the resource itself with --name/-n: exp rz create (the new realization, default realiot) and every exp xdc command (the XDC, default <experiment>xdc).
3c. Everything at once, guided: mrg-iot run
mrg-iot run is the one command that asks questions. It asks which project and devices you want (showing a numbered list), provisions an experiment, opens VLC viewers for any cameras, drops you at the spiot_ctl > prompt with the experiment's banner (its devices, cameras, and file-server login), offers you the files on the way out, and cleans up when you type exit (or press Ctrl-C).
mrg-iot run
On exit run always detaches the XDC, then asks whether to delete the XDC and whether to delete the experiment. Deleting the experiment also releases its hardware. A kept experiment keeps its realization and materialization too, so it goes on holding the hardware until you run exp teardown or its duration runs out. To use a kept experiment again, reattach an XDC with exp xdc attach.
4. Interact with the devices
4a. Choose an interaction
Commands to devices are written in the spiot_ctl control language: a device name, a command, and its arguments. Capabilities differ between devices, even between two of the same model, so ask the device itself rather than assuming:
mrg-iot cmd run "s-echodot-1 commands" -e myexp        # what this device supports
mrg-iot cmd run "s-echodot-1 click_button help" -e myexp   # how one command is used
To browse what the hardware can do before you have an experiment running, use the device catalog at devices.iot.sphere-testbed.net, which lists every device in the testbed along with its details.
The experiment-level commands are the same everywhere:
| Command | Description |
|---|---|
exp devices | List the devices in the experiment. |
exp cred <device> | Get a device’s application credentials. |
exp sleep <seconds> | Pause for N seconds. |
exp read <file> | Read a command file on the XDC and queue every line in it. |
exp clear <variable> | Forget a stored variable. |
<device> help / <device> commands | The commands that device supports. |
<device> <command> help | Detailed usage for one device command. |
query state <device> <command> <id> | Where a queued job has got to. |
query get_result <device> <command> <id> | The result of a finished job. |
query wait_result <device> <command> <id> | Block until a job finishes, then return its result. |
A sample of what device commands look like across the inventory. The exact set depends on the device:
| Device kind | Commands |
|---|---|
| Smart plugs | power_on, power_off, get_power_consumption, power_by_timing |
| Button pushers | click_button [timeout], hold_button <duration> |
| Speakers | play_tts "<text>", play_audio "<path>", start_capture, end_capture |
| TV / streaming | remote_press <button>, atv_remote <button>, roku_remote <button> |
| Android devices | tap <x> <y>, swipe <direction>, type "<text>", home, adb_shell <cmd> |
| IR blasters | send_ir <button>, hold_ir <button> <duration>, ir_cmds |
| Robot arms / plotters | move_to <x> <y>, press_button <position>, turn_dial <dial> <degrees>, list_positions |
The experiment validates its own input, so a missing or out-of-range argument comes back from the experiment rather than from mrg-iot. (mrg-iot still validates its own arguments: experiment names, durations, and so on.)
4b. Execute the interaction: mrg-iot cmd
The cmd group has one subcommand per way of waiting: run waits for the result, async-run doesn’t and leaves you a handle, wait/status pick that handle up later, and shell/ctl give you a prompt.
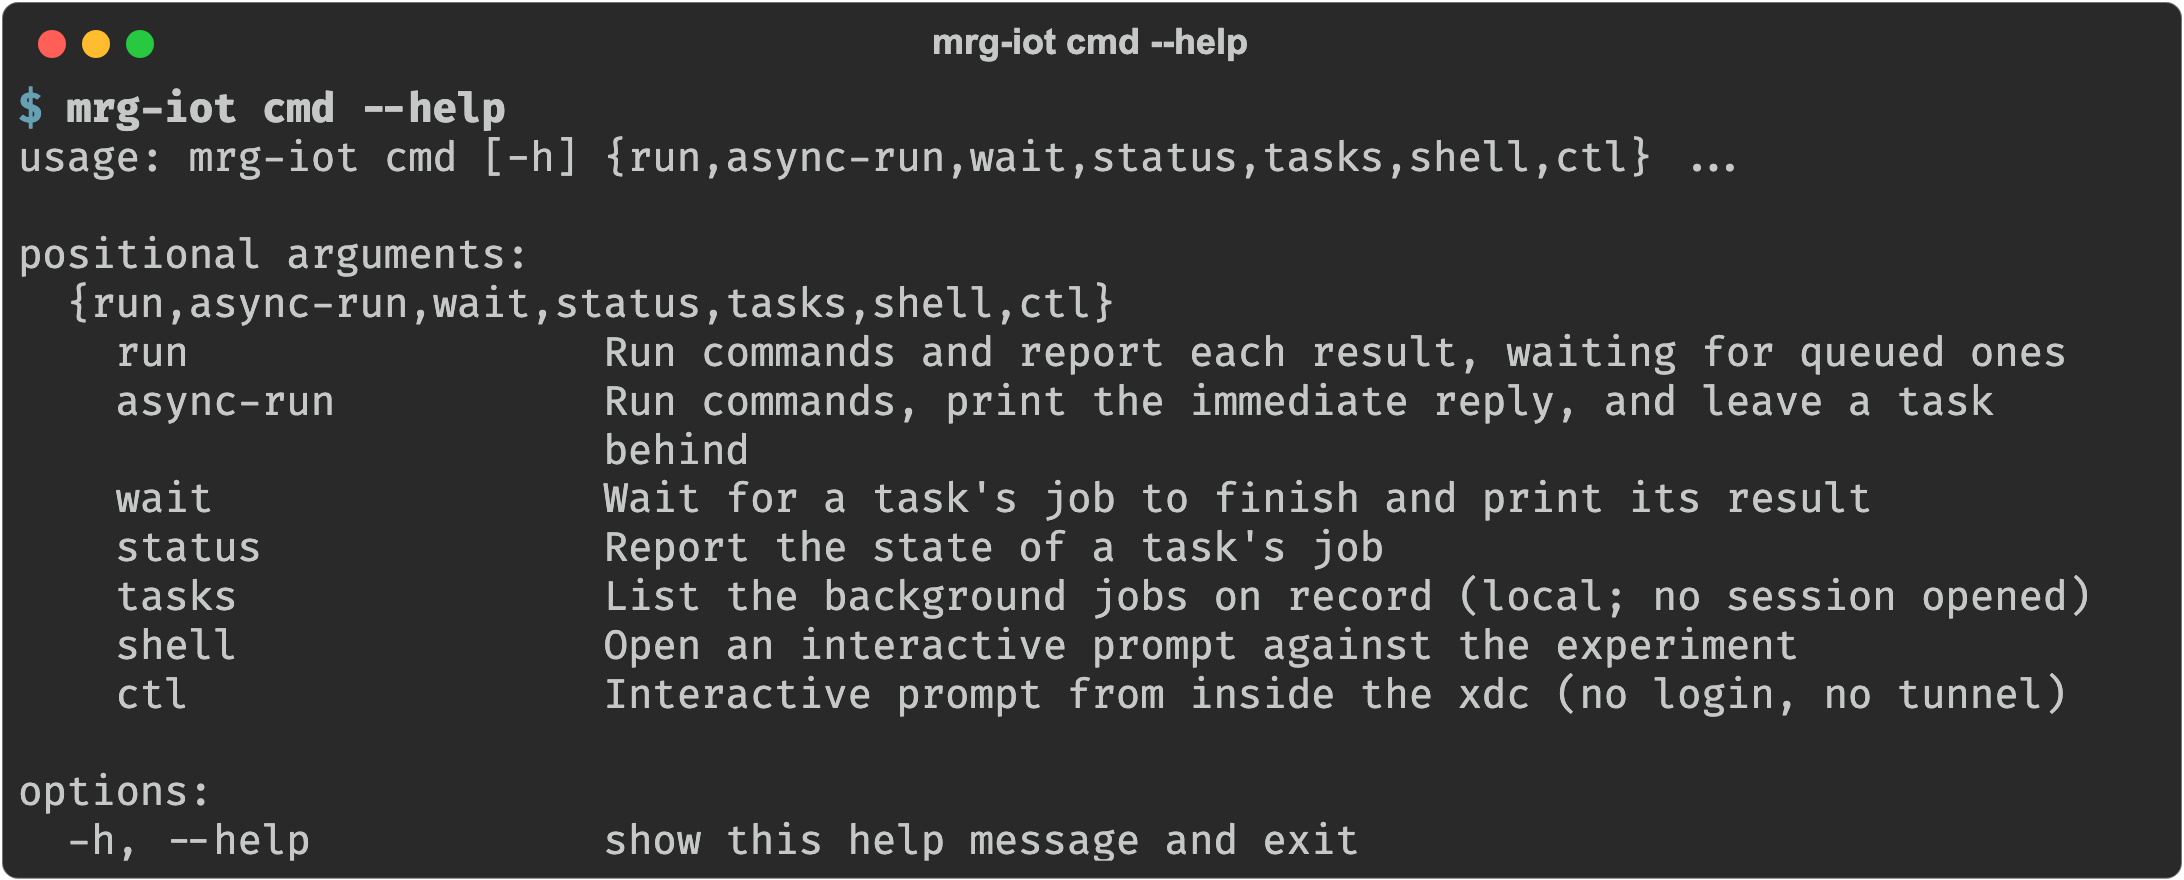
Run and wait
cmd run sends a batch of commands and prints each result:
mrg-iot cmd run "exp devices" -e myexp

mrg-iot cmd run "s-echodot-1 click_button" "s-echodot-1 power_off" -e myexp
A device command either answers immediately or is queued: the experiment takes the job, hands back an id, and works in the background. cmd run finishes the job for you: when a reply says “queued” it sends query wait_result and prints the real result, so one command in means one result out however long the device takes. Each device command is given up to 5 minutes before it times out.
Run without waiting
cmd async-run prints what came straight back and records the job as a task with a handle of its own (t1, t2, and so on) which you pick up in a later invocation:
mrg-iot cmd async-run "s-echodot-1 hold_button 10" -e myexp
# Command hold_button is queued
# ✔ t1: s-echodot-1 hold_button (job 3)

mrg-iot cmd tasks          # everything on record (local; opens no session; -p / -e to filter)
mrg-iot cmd status t1      # where it has got to
mrg-iot cmd wait t1        # block, then print the result
A handle carries the project, experiment, realization, and XDC its job was started in, which is what makes mrg-iot cmd wait t1 a complete command, with no flags needed. Job ids restart at 0 in every experiment, so they are never what you type.
Tasks are forgotten when the experiment they belong to is torn down, because a redeployed experiment starts counting job ids from 0 again.
An interactive prompt
mrg-iot cmd shell -e myexp
This is one foreground session you keep open and type into, at the spiot_ctl > prompt. Type exit (or Ctrl-C / Ctrl-D) to leave. History is saved to ~/.spiot_history.
If you are already inside an XDC, none of the SSH machinery is needed. The experiment is reachable directly over WireGuard:
mrg-iot cmd ctl              # default host 192.168.254.1
mrg-iot cmd ctl 10.0.0.5     # override the ExperimentControl host
Storing a result and reusing it
At the prompt (and in files run by exp read), -s captures part of a command’s reply into a variable, which you then reference with a leading underscore:
s-echodot-1 -s id job click_button
query wait_result s-echodot-1 click_button _job
-s takes a reference and then a variable name. The reference is id, result, or state.
Camera streams: mrg-iot stream
Camera-equipped devices are proxied over RTSP. Three subcommands watch them; push sends video the other way, and capture streams the experiment's live traffic into Wireshark. Both are covered below:
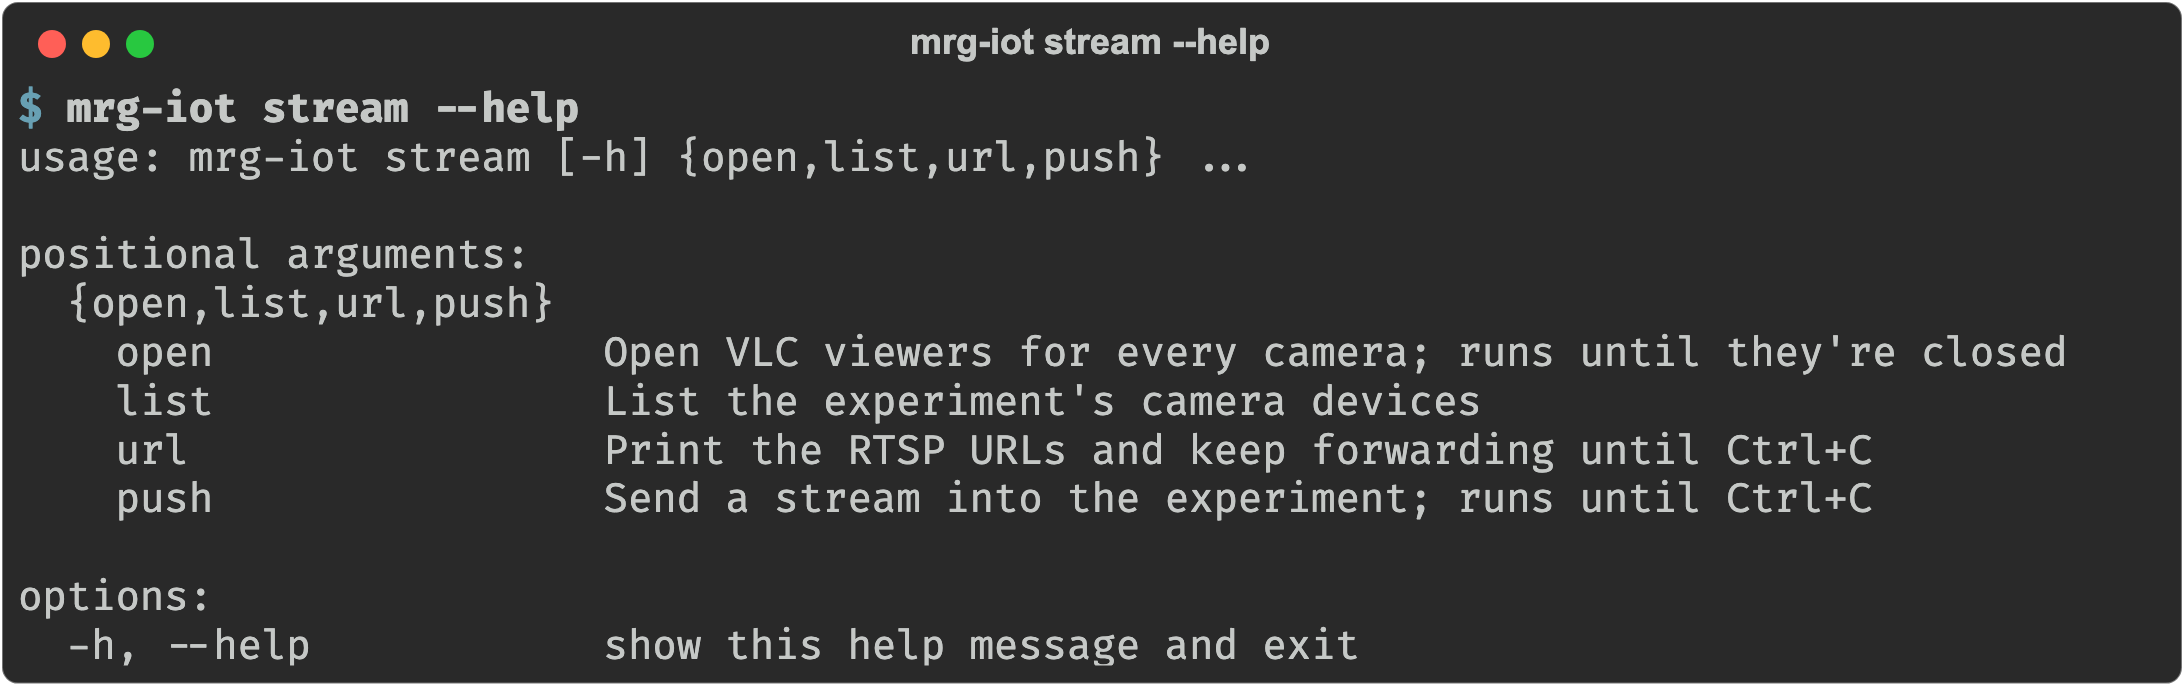
mrg-iot stream list -e myexp    # name the cameras
mrg-iot stream open -e myexp    # VLC viewers; runs until you close them
mrg-iot stream url  -e myexp    # RTSP URLs; keeps forwarding until Ctrl+C

The port in a stream URL is assigned per session, so stream list prints a <port> placeholder. Run stream url for the real addresses, or stream open to just watch them.
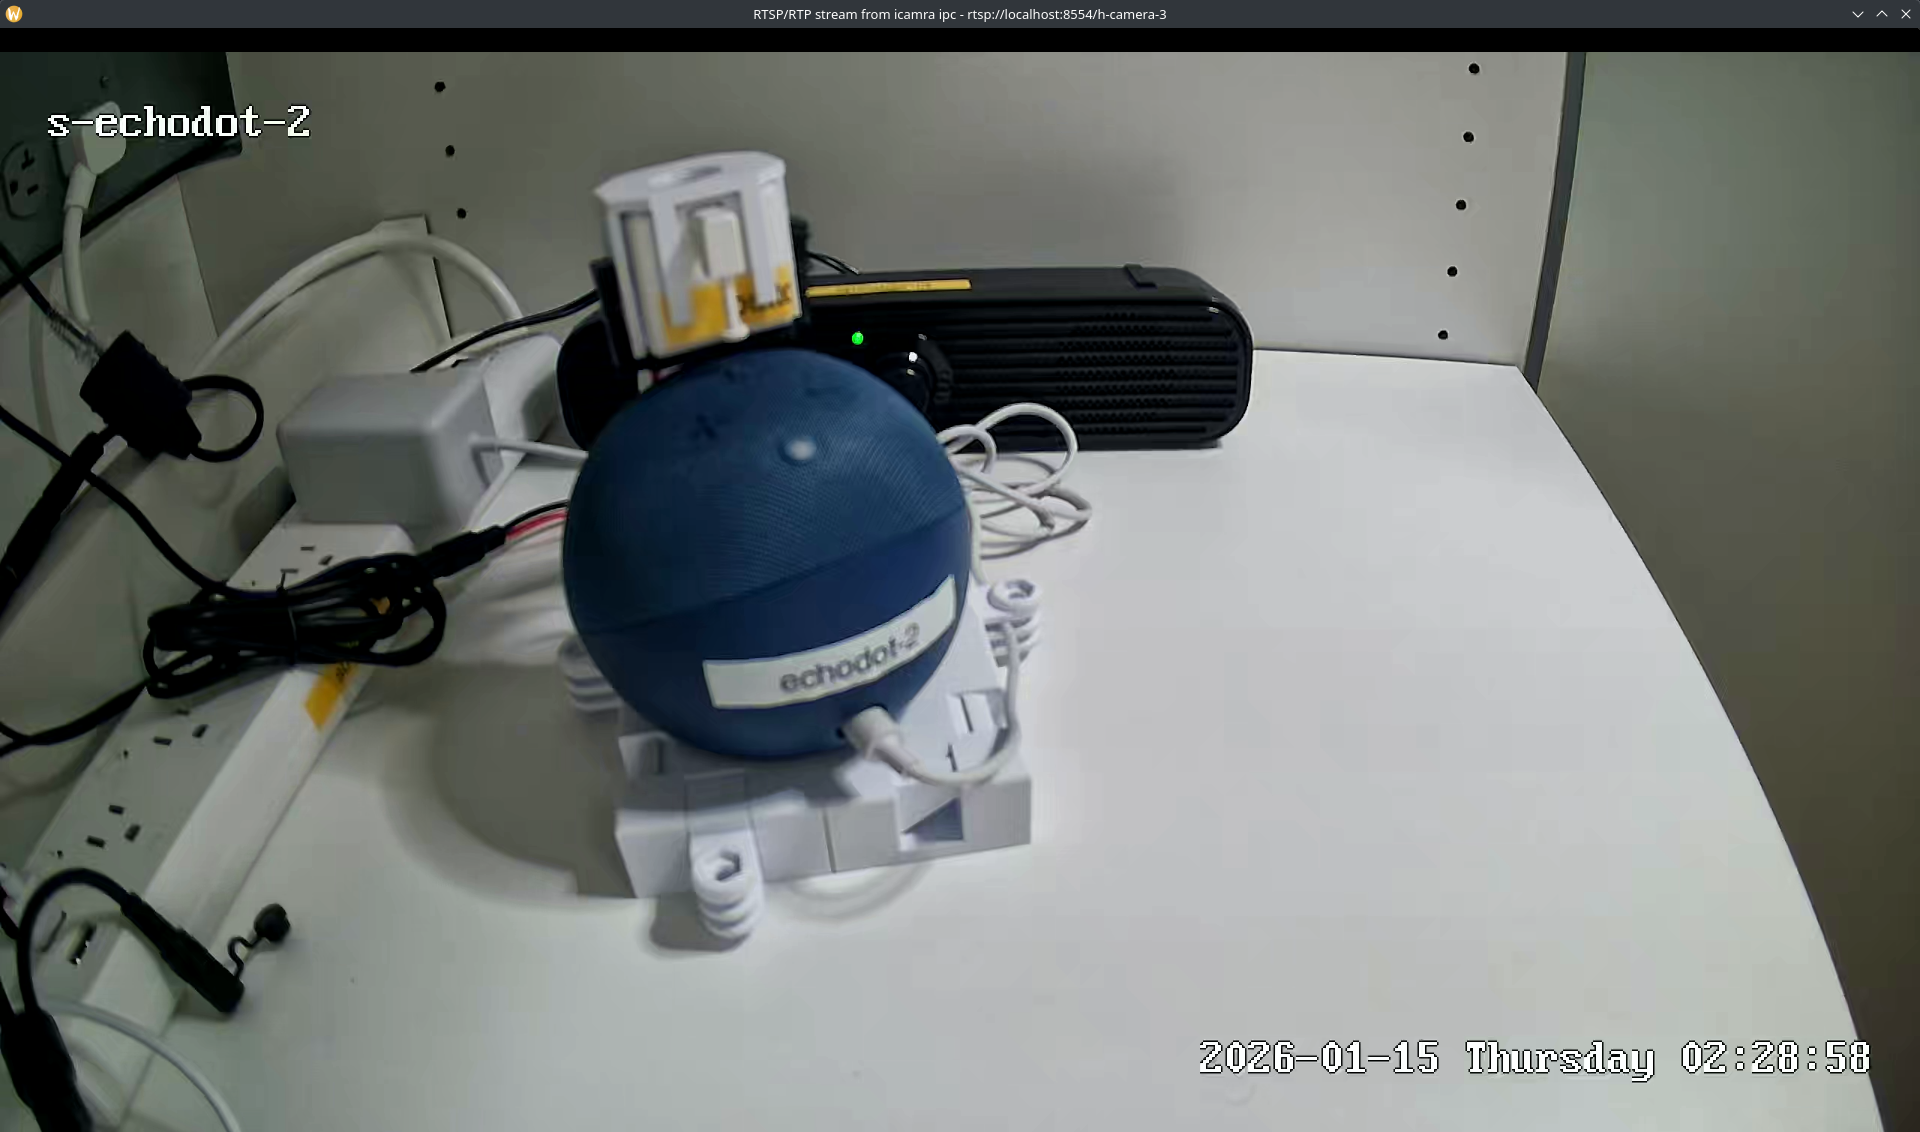
Because a stream is continuous, the command has to keep running to hold its tunnel open. Closing the command closes the feed. Prefer another player? Pipe the URLs to it:
mrg-iot stream url -e myexp 2>/dev/null | xargs vlc
Every mrg-iot command follows the usual Unix split between data and commentary, which is what makes that pipe work. See Output: stdout and stderr.
Sending a stream to a device: mrg-iot stream push
stream push is the opposite of stream open: instead of watching what a camera sees, you give a device something to watch. It needs ffmpeg on your PATH.
mrg-iot stream push clip.mp4 -d s-tvfeed-1          # play it once
mrg-iot stream push clip.mp4 -d s-tvfeed-1 --loop   # keep it running
mrg-iot stream push webcam -d s-tvfeed-1            # this machine's camera
mrg-iot stream push screen -d s-tvfeed-1            # this machine's screen
mrg-iot stream push rtsp://cam/feed -d s-tvfeed-1   # relay another stream
--device/-d is required, and names both the path the video is published under and the device that pulls it.
The command does two things, and both matter: it publishes the video into the experiment through the tunnel, and it tells the device to start watching once the video is really flowing, then to stop on the way out, before the tunnel closes. Ctrl-C is how you end it, and the device is always told before anything is torn down.
If the experiment's stream server can't carry the source's codec, stream push re-encodes it to H.264 and tries once more on its own. You don't need to convert a file first.
One device takes one stream at a time: a second stream push to the same device from your machine is refused until the first one stops. Pushes to different devices run side by side, each in its own terminal.
Without ffmpeg, stream push still prints the publish address and keeps forwarding it until Ctrl+C, so you can send a stream with any RTSP publisher. Then tell the device to start watching yourself:
mrg-iot cmd run "s-tvfeed-1 start_streaming" -e myexp
A camera or a screen is named however your operating system names it, so webcam:2 or webcam:/dev/video2 picks a specific one. On Windows, DirectShow addresses cameras by name: webcam:"Integrated Camera". Screen capture on Linux needs X11; under Wayland, push a recorded file instead.
Live traffic: mrg-iot stream capture
Every experiment records its traffic to a .pcap you download when the run is over. stream capture lets you watch the same traffic while it happens: it opens Wireshark already capturing, and packets appear as the devices send them.
mrg-iot stream capture -e myexp                          # everything, in Wireshark
mrg-iot stream capture -e myexp -f "udp port 53"         # only DNS
mrg-iot stream capture -e myexp -s 128                   # only the first 128 bytes of each packet
mrg-iot stream capture -e myexp -w live.pcap             # to a file instead of Wireshark
mrg-iot stream capture -e myexp -w - | tshark -r -       # to any tool that reads a pcap

--filter/-f takes a tcpdump capture filter, and --snaplen/-s how many bytes of each packet to keep (64 to 262144). Both are applied on the experiment, before a packet crosses the tunnel, so on a busy experiment they are what lets the capture keep up.
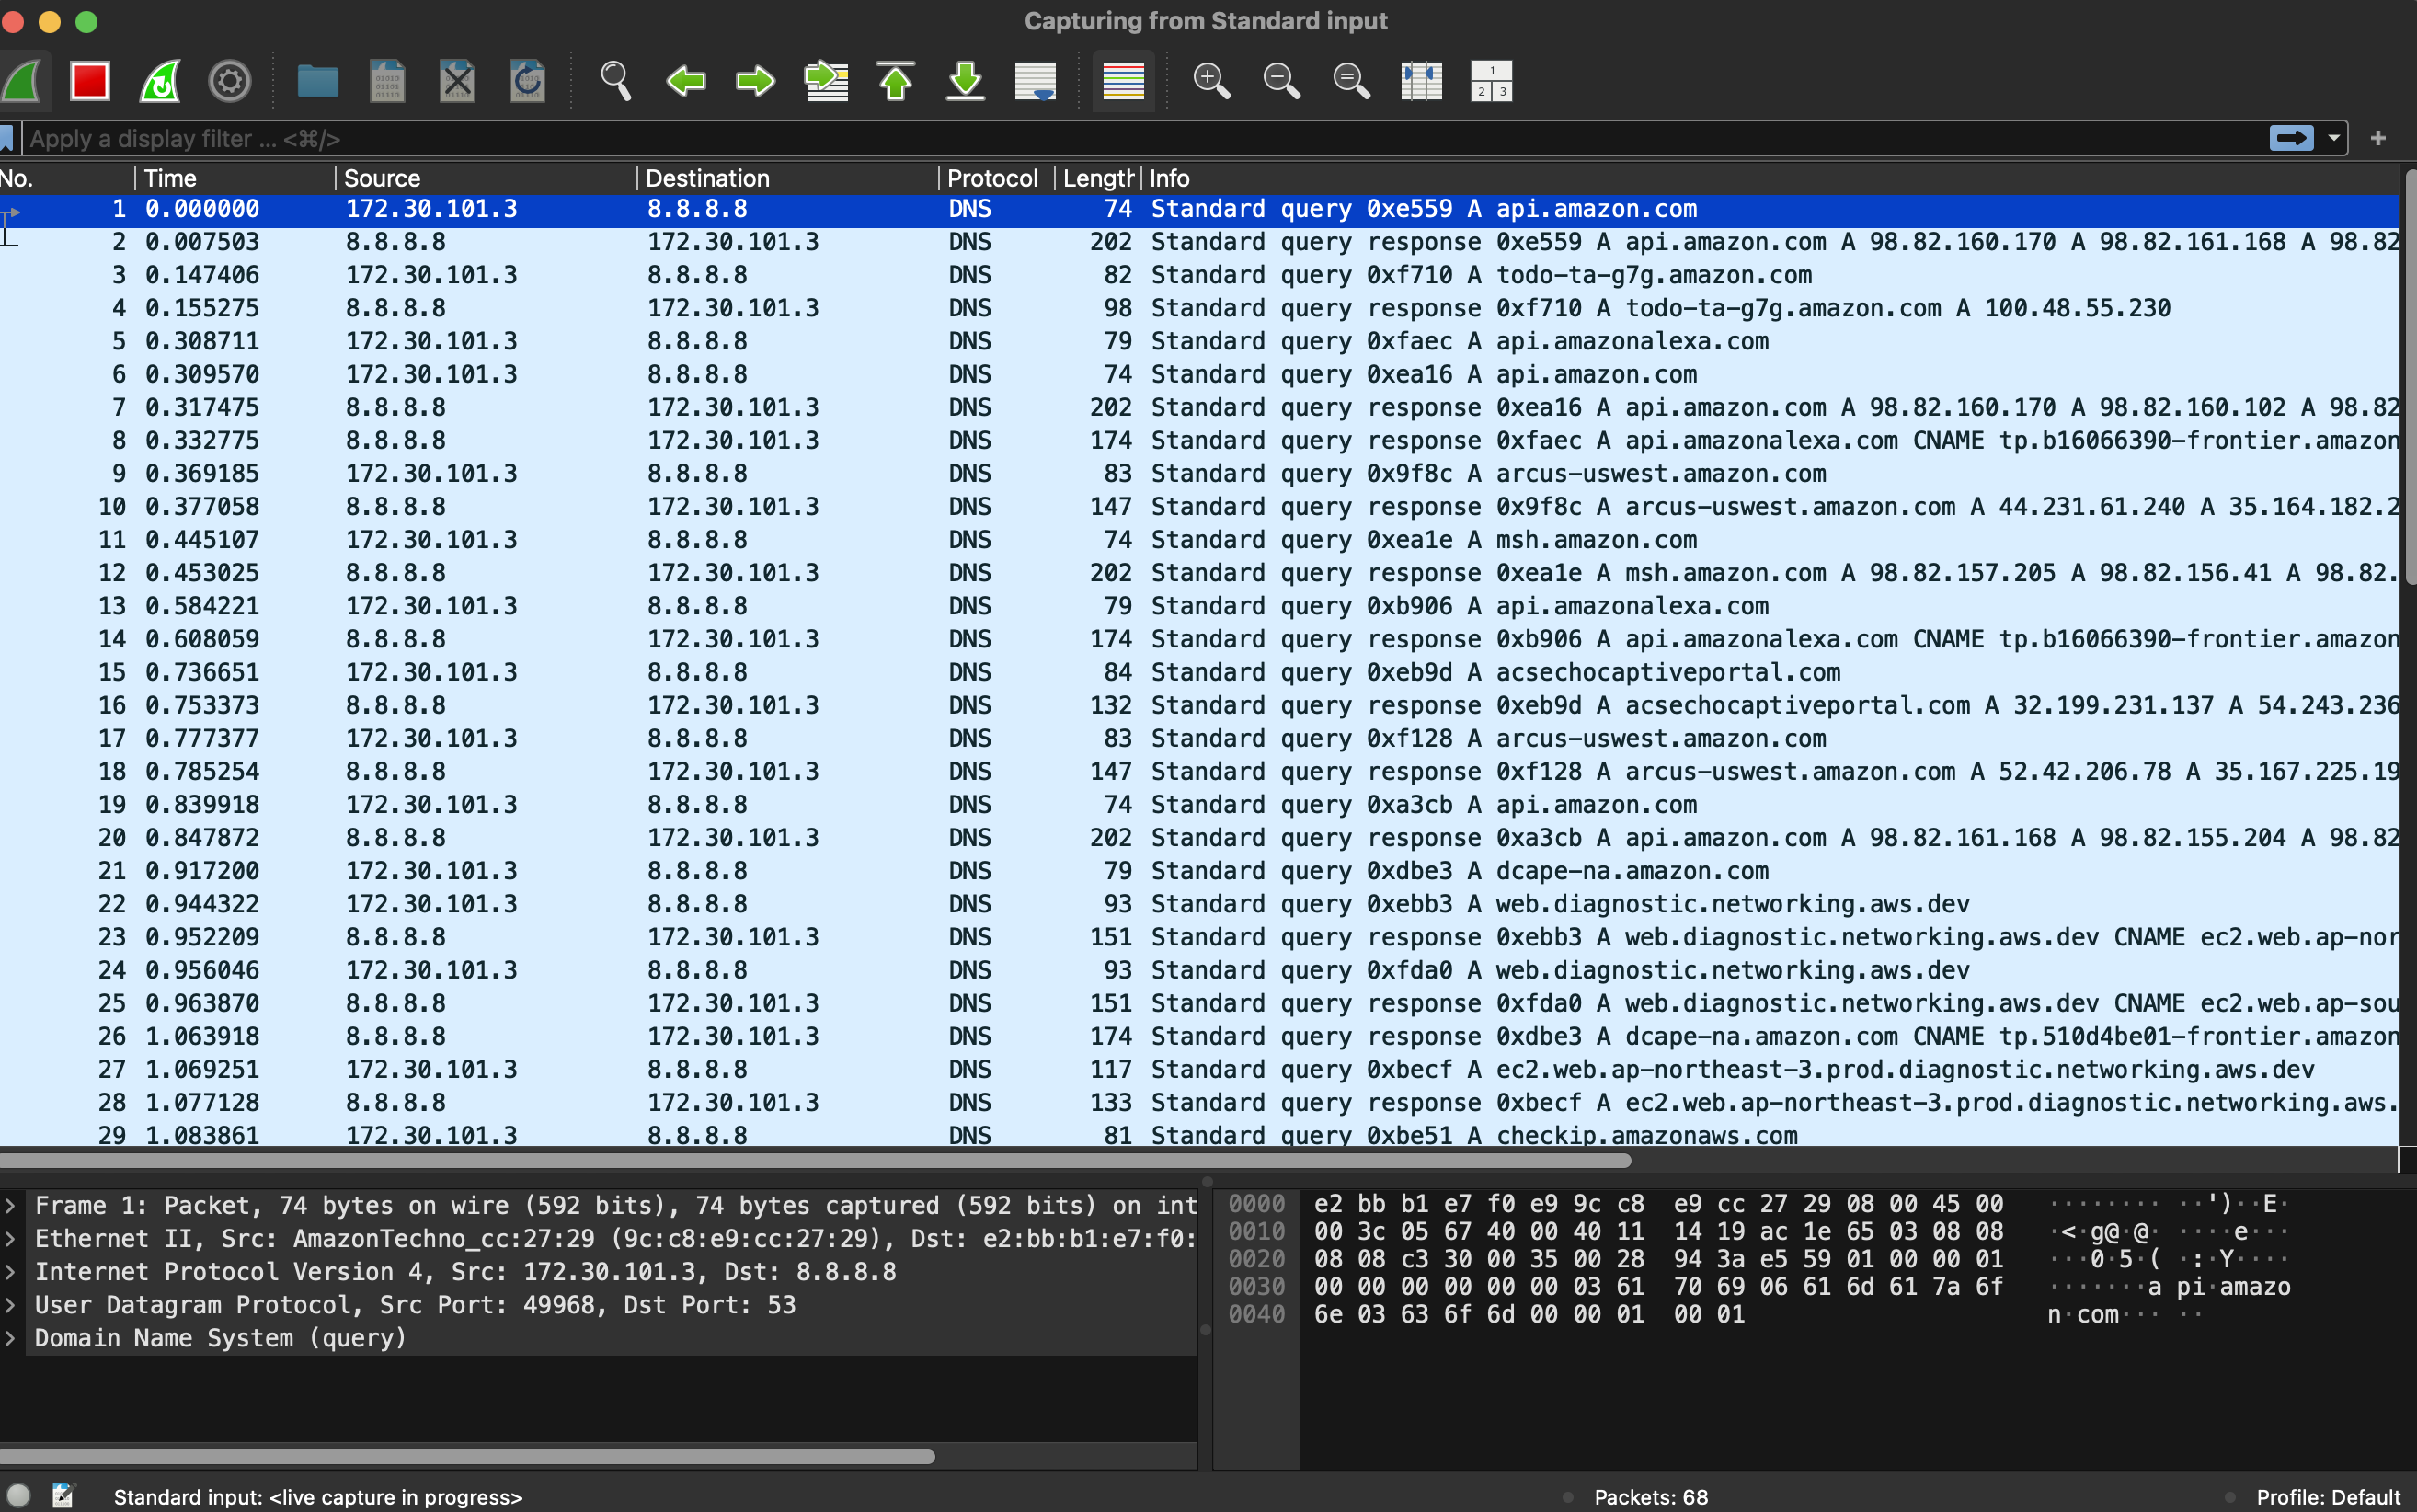
Each stream capture gets its own tcpdump, so a slow viewer only ever drops packets from its own stream, never from the recorded .pcap. Several can run at once, each with its own filter.
Closing Wireshark ends the capture. Ctrl+C ends it too but leaves the Wireshark window open, so you can still look through and save what was captured. With --write, Wireshark isn't needed at all; --write - puts the pcap on stdout and the narration on stderr, the same split described in Output: stdout and stderr.
5. Get your data: mrg-iot file
The experiment writes its capture and logs to a file server on the XDC, which mrg-iot reaches through a tunnel. The file group is how you move things in and out of it:
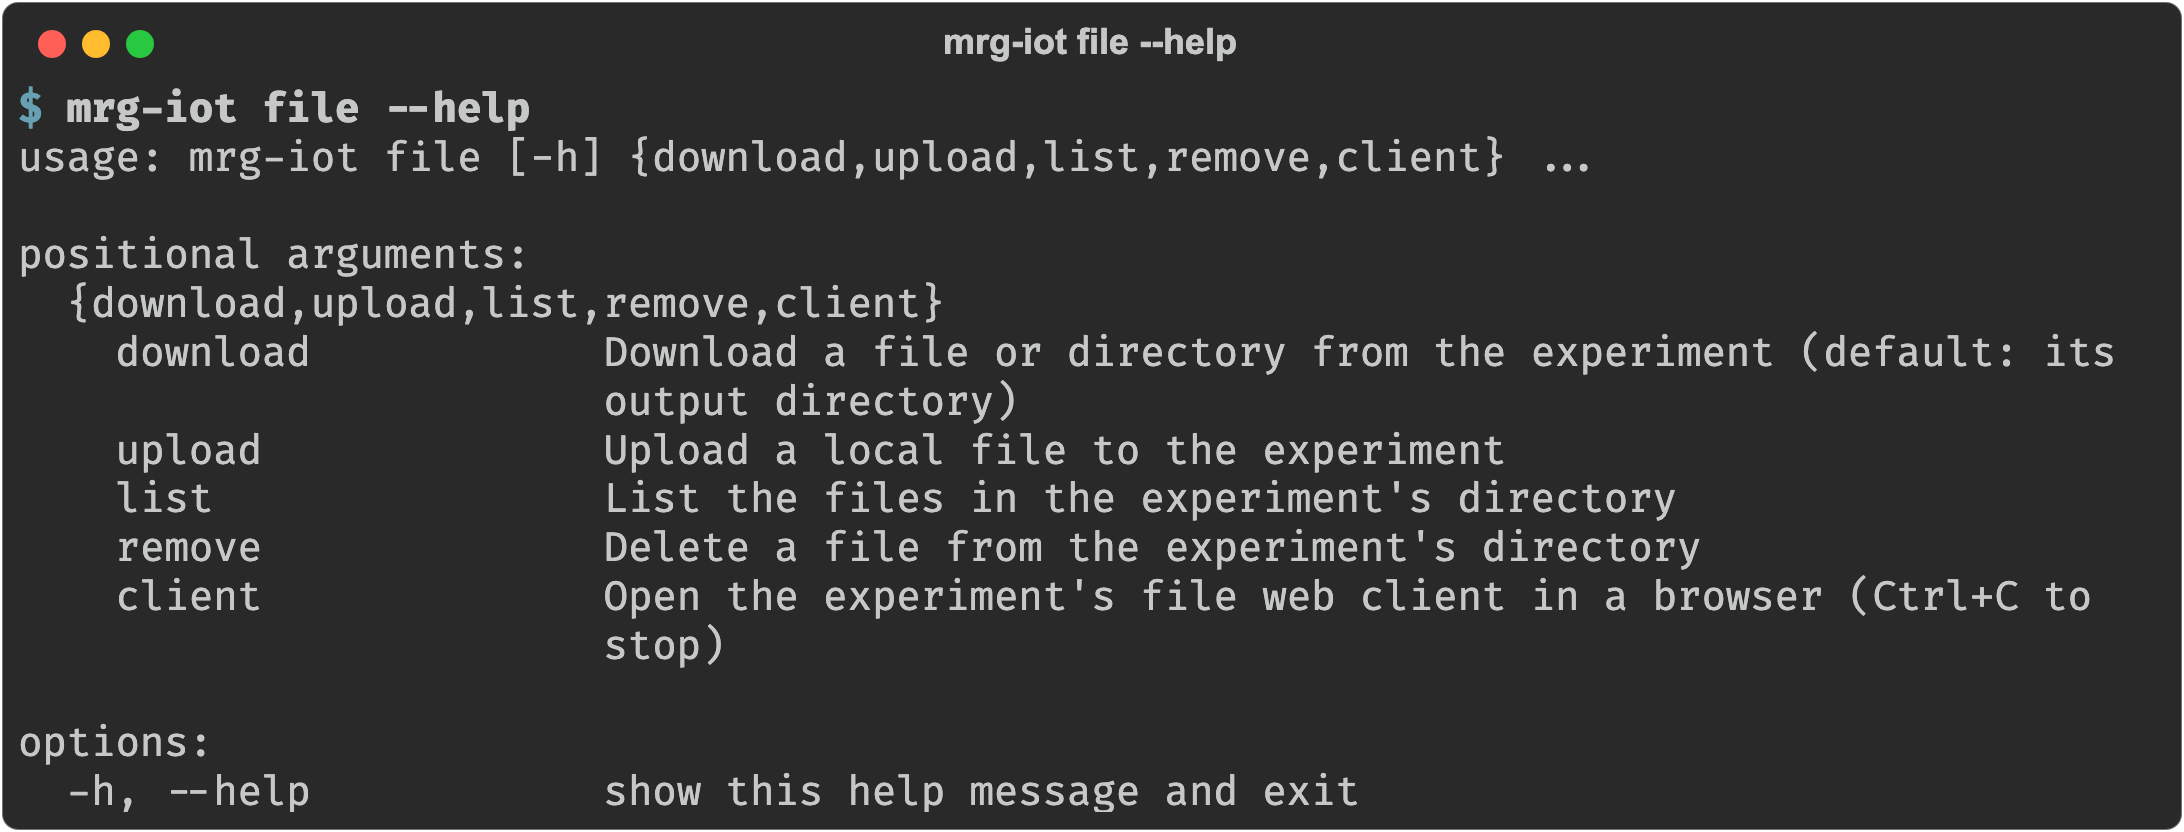
See what is there:
mrg-iot file list -e myexp              # the root
mrg-iot file list output -e myexp       # or any directory in it
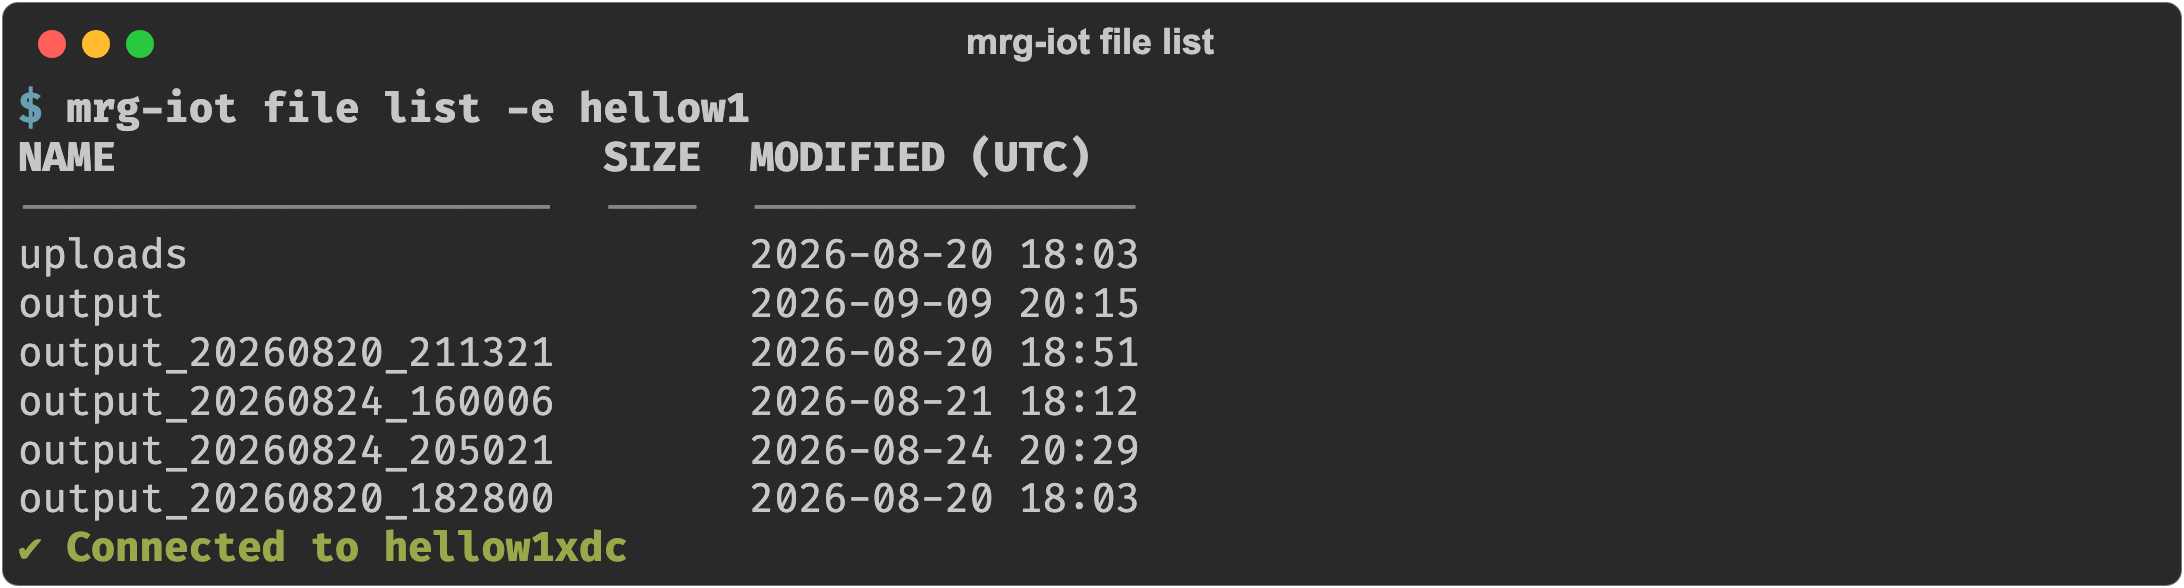
Download one file, or the whole output directory when you name nothing:
mrg-iot file download -e myexp                          # → ~/Downloads/myexp.output.zip
mrg-iot file download output/capture.pcap -e myexp      # → ~/Downloads/myexp.output.capture.pcap
mrg-iot file download capture.pcap -o /tmp/run.pcap -e myexp
A download is named <experiment>.<remote path>, with every / turned into a .. That keeps two facts a bare basename would lose, namely which experiment the file came from and which directory it sat in, so output/capture.pcap and traces/capture.pcap don't overwrite each other. Pass --output/-o for a name of your own. If the -o path doesn't exist yet and has no extension, it is created as a directory (-o myarchive → myarchive/<download>); anything after a dot counts as an extension, so -o exp.2026-09-25 is written as a file.
Uploading and deleting work in the root only; uploads always land in uploads/:
mrg-iot file upload ./video.mp4 -e myexp
mrg-iot file remove capture.pcap -e myexp
Or browse the share yourself:
mrg-iot file client -e myexp # opens the web client in a browser, until Ctrl+C
file client prints the web client's address and the file-server username and password to log in with, then opens it in your browser. You can upload, download, and delete from there. The page works only while the command keeps running, so press Ctrl+C when you are finished. The local port changes every time, so there is no address to bookmark.
There is no globbing, and a path is relative to the share’s root, never to your machine. Run mrg-iot file list and use the name it prints.
The output archive contains at minimum a log file and a .pcap network capture. Anything your commands produced, such as screenshots and command output, is in there too.
6. Stop the experiment: mrg-iot exp
exp teardown is the inverse of exp setup: it detaches and deletes the XDC, deletes the materialization and realization (releasing the hardware), and deletes the experiment record.
mrg-iot exp teardown myexp

To release the hardware but keep the experiment so you can redeploy it later:
mrg-iot exp undeploy myexp    # detach → delete xdc → delete materialization → delete realization
mrg-iot exp deploy myexp      # ...and bring it back when you need it
Both report each resource they removed, and a resource that is already gone is reported as skipped rather than as a failure, so re-running either one is safe and still exits 0.
If you interrupt provisioning with Ctrl-C, or finish without tearing down, the experiment, realization, materialization, and XDC are kept so you can reconnect. They hold your hardware and count against your quota until their duration expires. Run exp teardown when you are genuinely done.
Download anything you want to keep before tearing down. The share goes away with the experiment, and so do any task handles left by cmd async-run.
Command reference
Every command, with its usage, flags, and an example, has a page per group. They are also listed under Using mrg-iot in the sidebar.
mrg-iot login / logout: Log in to the SPHERE portal and clear the stored session.mrg-iot devices: List free devices and describe the ones in your experiment.mrg-iot exp: Create, deploy, inspect, and tear down experiments and their resources.mrg-iot cmd: Send spiot_ctl commands to a running experiment.mrg-iot stream: Watch camera streams and live traffic, and send video to devices.mrg-iot file: Move files to and from a running experiment.mrg-iot run: The whole experiment lifecycle in one command.
Output: stdout and stderr
mrg-iot follows the usual Unix split, so its commands compose with other tools:
- stdout carries the primary output and nothing else: tables, key/value blocks, and verbatim output from the experiment or the portal.
- stderr carries everything else:
✔/✖/▲lines, progress narration, banners, prompts, and spinners.
So a redirect collects the data, and the commentary still reaches your terminal:
# Just the URLs, straight into a player.
mrg-iot stream url 2>/dev/null | xargs vlc

# Just the table, with the ✔/▲ lines still on screen.
mrg-iot exp list > experiments.txt

# A failure is reported on stderr and never written into the data file.
mrg-iot exp status doesnotexist > out.txt || echo "failed; out.txt is empty"

# Second column of your experiments, skipping the header and rule.
mrg-iot exp list 2>/dev/null | awk 'NR>2 {print $2}'
Two things deliberately stay on stdout because moving them would break something: the cmd shell / cmd ctl prompt, because readline has to own the prompt string for arrow-key editing and history (the same reason python, psql, and sqlite3 do it), and --help, which argparse writes there by convention. Password prompts go to /dev/tty and are on neither stream.
Exit codes
Each code names what failed, not where in a sequence it failed. The order follows the pipeline, so a higher code means the run got further:
| Code | Meaning |
|---|---|
0 | Success |
1 | General failure: it asked the portal and the answer was no |
2 | Input this tool rejected before calling the portal (bad name, duration under 4 days, unresolvable project) |
3 | The experiment could not be created |
4 | The model could not be built or pushed |
5 | Realization failed |
6 | Materialization failed |
7 | The XDC could not be created or never became ready |
8 | Attaching the XDC to the realization failed |
9 | The session (SSH / tunnels / ExperimentControl) could not be established |
10 | Cleanup failed |
130 | Interrupted with Ctrl-C |
Logs and tracing
Every run appends to ~/.mrg-iot/debug.log (rotated at 5 MB, 3 files kept). For a detailed trace of one run, set MRG_IOT_TRACE in the environment. There is no --debug flag, because tracing belongs to your shell session rather than to one command:
MRG_IOT_TRACE=1 mrg-iot exp status myexp                                # DEBUG records echoed to stderr
MRG_IOT_TRACE=1 MRG_IOT_TRACE_FILE=/tmp/mrg.log mrg-iot exp status myexp  # ...or collected in a file
MRG_IOT_TRACE accepts 1, true, yes, or on; anything else, including 0, leaves tracing off. Attach debug.log and the output of mrg-iot --version to any bug report.
What lives where on your machine
Everything user-scoped is under ~/.mrg-iot/:
| File | Purpose |
|---|---|
session.json | Your cached login: {"username", "token"} (mode 0600). |
debug.log | Verbose log, appended across runs, rotated at 5 MB (3 kept). Attach this to bug reports. |
tasks.json | Jobs left running by cmd async-run, so cmd wait / cmd status / cmd tasks can name one later. |
There is no cached connection state: which enclave a command targets comes from its flags, or from the defaults above, every time.
Next
- Troubleshooting & FAQ: symptoms, causes, and fixes.
- Quickstart: the same flow, condensed to a handful of commands.